|
|
|

This section looks at the the various ways in which sand dune surveys can be used to meet the demands of AS and A level coursework. The advice given in general terms only and you must look at the precise coursework requirements for the specifications / syllabus you are using. If you are unsure about these you need to look at the websites of the awarding bodies. Try the hyperlinks below:
OCR
AQA
WJEC
Most syllabuses expect you to clearly state the aims of your research.
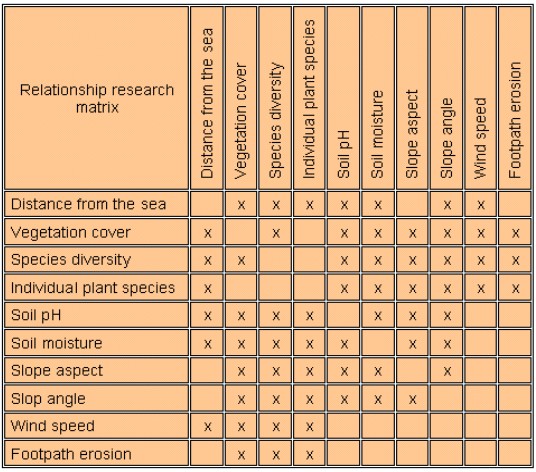
The main aims of the fieldwork are to explore the structure of the sand dune ecosystem and the effects that humans have had on it. In particular you should be looking to see if you can find any relationships between the variables for which data is collected. Some relationships that you could examine are marked by 'x's in the figure below.
You should also:-
|
Examine any issues which surround man's current and potential use of the dune system | |
|
Determine the extent to which the management plan is achieving its objectives |
While the collection of data will be a group exercise, the ways in which the data is displayed, processed and used to support arguments and hypotheses are entirely your own responsibility. You are advised to collect any extra data which you think you may help to give your fieldwork enquiry a unique approach.
It would be a very good idea to bring a camera and some colour film. Photographs may form useful evidence in support of the text of your enquiry by showing:-
• The various zones within the psammosere
• Individual plant and animal species
• The effects of humans
• Colonisation and sand dune evolution processes
Sharing of photographs between team members is permitted provided but you must acknowledge the source of any photographs you use in your enquiry which are not your own. You are strongly advised to take your own photographs.
DATA COLLECTION
You will be a member of a one of several teams. Each team will collect the following data from transects running inland from the high water mark at 90o to the coast:-
1. Topographic profile
2. Vegetation cover & diversity
3. Soil pH, moisture and temperature
4. Animal, insect and bird life
5. Wind speed
Records of 2 to 5 should be made for each slope segment, or where segments are large, wherever a significant change in the amount or type of vegetation is observed. Whenever records are made a note should be made of the distance from the start of the transect. At various points, special surveys of footpaths and recently cleared land may also need to be carried out. Responsibility for all these tasks must be shared out as equally as possible between team members.
1. Topographic profile
Starting from the high water mark angle and distance should be measured between each significant change of slope. Record the details of each slope segment on the Topographic Logging Sheet. Ignore small scale fluctuations (microrelief) within larger slope segments. Slopes facing the sea must be recorded as positive (e.g. +25o) and those facing inland as negative. Two methods of measuring slopes are possible depending on the equipment available. The best method involves the use of ranging rods, a tape and an abney level.
• Insert ranging rods at the breaks of slope at the beginning and end of each segment and measure the distance between them. Take care to insert each rod to the same depth.
• Record the distance of the beginning of the segment from the start of the transect.
• Looking inland and holding the abney level at a defined point on the first ranging rod, assess the angle of the same point on the second rod. Record the figure in the foresight column.
• Repeat this exercise looking backwards from the second ranging rod, recording the angle in the backsight column.
• Calculate and record the mean of these two angles
The second method makes use of a clinometer instead of an abney level, otherwise the process is the same. Note, however, that while one person lines up the clinometer with the opposite ranging rod, another person will have to read and record the angle.
In the Aspect Column, note the direction that the slope is going down in at its maximum angle. Your transect, being at 90o to the coast, will not necessarily ascend and descend slopes by their steepest routes.
In the Comments Column record the nature of any microrelief and the sector of the dune system which you believe you are in, e.g. embryo dunes, mobile dunes, wet slacks, etc.
2. Vegetation cover and diversity
Place a quadrat at a typical point in the segment, estimate and record the percentage of the land that is covered by vegetation. Try to ensure that your record reflects the average conditions for the segment or location within it. Without moving the quatrat, identify the main plants and estimate and record the percentage of the area within the quadrat that each covers. All records should be entered on the Vegetation Survey Sheets.
You will need to use field guides to identify grasses, flowering plants, shrubs and trees. Pay full attention on the guided tour and your job should be easier. If there are any plants you cannot identify write down a description on some rough note paper and/or consult the staff. Likewise with any wildlife.
In the Miscellaneous Column record any other information about the vegetation, e.g. maximum height, the presence of any layers and their height above ground level, evidence of shrub clearance, trampling, etc.
3. Soil pH, moisture & temperature
Record these variables at each point that a quadrat analysis of vegetation is made. Meter probes should be inserted to a depth of about 4cms in the centre of the quadrat.
4. Animal, insect and bird life
Record this when and where there is evidence of it, e.g. burrows, dung, feathers, etc.
Where possible name the species present, otherwise record the general type of creature, e.g. 'moth', 'caterpillar', etc. Estimates of numbers per unit area would also be useful.
5. Wind speed
Wind ventimeters should be held at arms length above your head and turned so that the aperture is facing directly into the wind. Allow 20 seconds exposure to the wind before taking a reading.
Footpath Surveys
For one footpath that you cross on your transect carry out the following survey:-
• Insert ranging rods at either side of the path within vegetation which does not appear to have suffered trampling.
• Peg out a tape across the path, making sure that it is taut and horizontal
• At regular intervals measure and record the distance from the tape down to the ground
• At the same intervals carryout a quadrat analysis to determine vegetation cover, height, species present, etc. It does not matter if quadrats overlap.
• Record your data on the footpath survey sheet.
Other data, techniques, etc.
Having read through the articles on the Ainsdale Sand Dune System, you may feel that there are relationships which need testing, for which the transect data is inappropriate. Assessing the degree of success achieved by the management plan may come into this category. Some time will be made available for you to collect other data via your own methods. It may still be a good idea to work in groups so that equipment can be shared.
DATA SHARING AND PROCESSING
At the end of the transect all data should be shared so that each team member has a copy. Each team must also produce a further copy for the field trip leader. Once back at college you will receive a copy of all the data from the other transects.
WRITING UP YOUR FIELDWORK ENQUIRY
All fieldwork enquiries must be properly structured. Outlined below, in a logical order, are the main sections which your enquiry should include. Some of these sections may be combined under simpler titles but their overall material and arguments must still be present.
1. Title: should indicate clearly the research work included in the enquiry
2. Contents: should be listed by page number. Major sections should start at the left margin with subsections indented and page numbers at the right margin
3. Executive Summary: this is a very short statement (usually less than 200 words) which outlines the nature of the research, the methods used and the results and conclusions.
4. Introduction, Aims and objectives: Before you go out into the field you should have read all the articles and guidelines provided by the staff. You will need to draw up a list of your own aims and objectives and general areas of research. An 'aim' are broad areas of intent, e.g. to make a cup of tea; 'objectives' are more precise targets which need to be achieved in order to fulfil the aim, e.g. find the tea bags, kettle, teapot, cup, milk; boil the kettle, pour the boiling water onto the tea bags in the teapot, wait for it to brew, etc. For each objective, you will also need to establish 'methods' which you feel will provide you with the necessary data.
5. Statements of research questions, issues or hypotheses: these should be closely related to the objectives. Having read the background material and revised your theory notes you should be able to draw up a list of relationships you might expect to find in the field or problems which need investigating. Hypotheses should take the form of clear testable statements, e.g. "Vegetation cover increases with distance inland from the high water mark", which can be proved OR disproved by data collection and analysis. Following each hypothesis you should give a brief theoretical explanation of why you would expect the relationship to occur.
6. Methods of data collection: for each element of the research certain data will need to be collected. Data that you collect yourself or in collaboration with other students is called Primary Data. You need to identify and describe the types of primary data collected and the methods used for collection. You should also explain the limitations in the quality of the data or the methods used and suggested how both could be improved in ideal circumstances. Any data which you derive from other sources is described as Secondary Data; the 'Sefton Dunes Management Scheme' handouts would come under this category.
7. Presentation of the data: the methods used will depend on the type of the data but tables, graphs (of various types), photographs and descriptions appropriate for the sand dune material. 'Stacked line graphs' and 'kite diagrams' are particularly useful for showing how variables change in relation to each other with distance from the sea. You may well be able to use computer spreadsheets such as 'Excel' to generate graphs and charts. This is fine, but you may well be able to improve on the standard computer print-outs by adding your own labels or inventing your own method of display. Make sure that you use methods which communicate the data in an appropriate form to the reader, so that it is easily understood and always remember to give each diagram, graph, etc., a title and a figure number, which you can use for reference in the text.
8. Analysis and interpretation of the data: this should address the research areas identified in section 5. Statistical, graphical, and literary techniques. Testing relationships of sets of numerical data can be easily achieved using methods such as Spearman's Rank Correlation, Pearson's Product Moment Correlation and Chi Squared Tests. Pearson's is the quickest and most accurate method if you are going to use 'Excel'. Which ever tests you use you will need to determine the statistical level of significance of the results, before commenting on what they prove, disprove or suggest. If you stated any hypotheses earlier in your enquiry, you will now need to describe and explain the extent to which they have proved to be correct.
9. Evaluation, conclusions and further research suggestions: how successful is your enquiry? Has it been limited by a shortage of time, equipment, etc.? Suggest how the work could be improved under better circumstances. You may also find during your data collection and analysis that you discover completely new areas of research and relationships which now seem worth investigating; you should outline these at these at the end of you enquiry.
10. Bibliography: a list of all secondary sources, books, articles you have used, plus the names of any individuals who have helped you with an outline of the help received.
11. Appendices: include at the end any bulky material such as original record sheets, transect graphs and tables, which would make your enquiry difficult to read if they were incorporated in the body of the text. Give each category of material a name, e.g. Appendix A, B, etc., so that your can refer to it in the text.